Introduction and objective
There has been an increasing interest recently in understanding physician-level discrepancies in patient outcomes as part of healthcare reform. We aim to evaluate urologist-specific variation in outcomes for patients who underwent nephrectomy for clinical T1 (cT1) renal masses.
Methods
A retrospective analysis of patients ≥18 years old with cT1N0M0 renal masses who underwent partial or radical nephrectomy (RN) at our institution between 2003-2019 was performed. Outcomes of interest included the use of RN, use of an open approach (OA), benign tumor pathology, positive margins, postoperative complications, length of stay (LOS), intensive care unit (ICU) admission, operative time (OT), ischemia time (IT), and estimated blood loss (EBL). Hierarchical mixed-effects linear and logistic models with urologist-level random intercepts were fit to assess the different outcomes, adjusting for various patient (age, sex, race, comorbidities, year of surgery), tumor (size, nephrometry score, grade), and procedure (ischemia type, surgical approach) characteristics; case-mix adjusted rates of each outcome were obtained for individual urologists.
Results
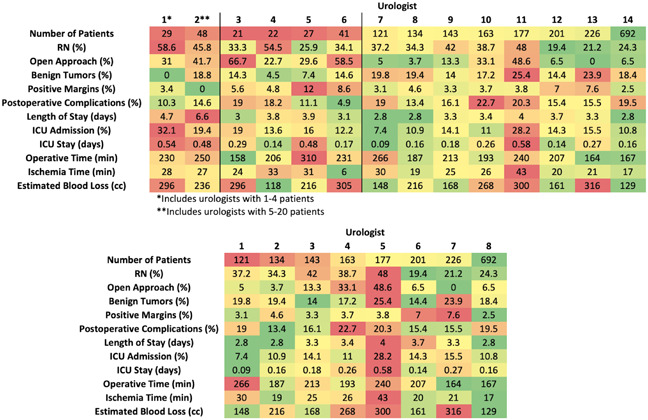
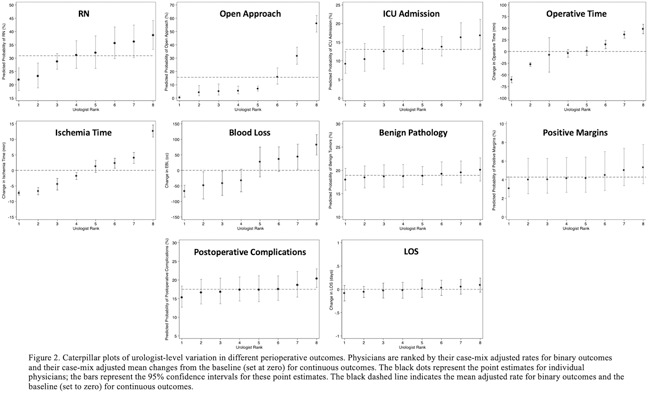
A total of 2045 patients and 38 urologists were identified. Only 8 urologists treated >100 patients each. There was notable between-surgeon variation in the raw rates of the different outcomes, as depicted in the heatmap plots for all urologists and for only those with >100 patients (Figure 1). Upon multivariable mixed-effects modeling among the high-volume urologists, there was significant urologist-specific variation in the use of RN, use of an OA, ICU admission, OT, IT, and EBL; no significant variation was noted for benign pathology, postoperative complications, positive margins, or LOS (Figure 2).
Conclusions
Significant urologist-level variation in perioperative outcomes exists for patients with cT1 renal masses. These data establish a framework for developing quality-improvement measures to minimize unwarranted variation and potentially improve the delivery of guideline-based care.
Figure 1

Figure 2
